Unfolded Studio now supports working with high bit-depth raster data via the new Raster Tile Layer.
The Raster Tile Layer provides a new level of interactive visualization and analytics capabilities for users of remote sensing data.
About Remote Sensing Data
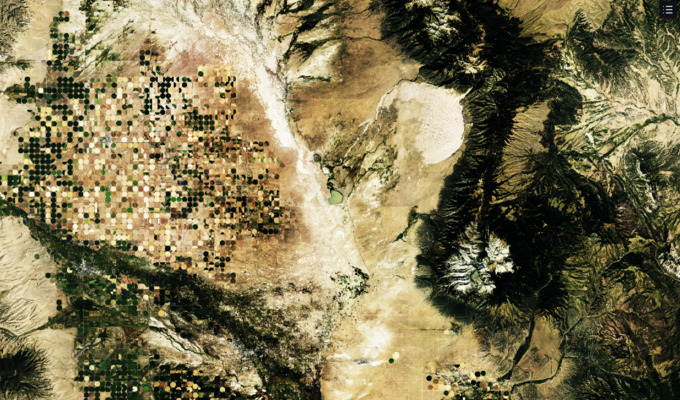
The Raster Tile Layer is designed to support raster data sets that are commonly derived from remote sensing sources such as satellites.
Remote sensing data are collections of images, but these images are different in important ways than the images your phone might capture. Two main differences are the multiple wavelengths of light captured and the high bit depth data stored in each pixel. The Raster Tile Layer is designed to make full use of this additional data.
Multiple wavelengths of light
Satellites like Landsat-8 and Sentinel-2 have specialized sensors that capture around a dozen different wavelengths of light reflected off the earth.
Beyond capturing visible light reflected off the earth (normally represented as red, green and blue bands), there are other wavelengths of light that are important for scientific analyses.
For example, many remote sensing datasets also contain a near-infrared band. Near-infrared light has a wavelength that falls outside the visible range, but is valuable for vegetation analyses because near-infrared light reflects off the chlorophyll in plants. Thus, areas with denser vegetation have more near-infrared light that is captured by the satellite’s image sensor. Other wavelengths can indicate geologic information, thermal energy, etc.
High bit depth data
Remote sensing images are often high bit depth, meaning that each pixel has a broader range of possible values. For example, the Landsat-8 satellite produces data with a 16-bit depth, containing 2^16 = 65,536 unique values, and the Sentinel-2 satellites produce data with a 12-bit depth, containing 2^12 = 4,096 unique values.
In contrast, traditional image formats typically have 8-bit depth. This means the pixel values have a range of 2^8 = 256 possible values for the red, green and blue channels. While this traditional color depth provides a reasonable compromise that balances the need to produce a good visual image with file sizes, it significantly limits the amount of information available for analytics.
Front-end GPU-powered analytics
The new Raster Tile Layer provides fast and user-friendly raster processing in your browser.
Because the Raster Tile Layer loads high bit depth data directly into the browser, many calculations that traditionally require server round trips can now be performed almost instantly on your local GPU.
In contrast, most traditional approaches to raster tile rendering are server-powered. This means all processing steps happen on remote servers, where pre-rendered low bit depth images are sent to your web browser for display. A major disadvantage with this is that any change to visualization parameters or analytic calculations require server round trips, where the user has to wait, often for seconds, for a complete set of new image tiles to be reloaded.

Note that the Raster Tile Layer does leverage the Unfolded Cloud to access source images. However, the Unfolded Cloud only performs a minimal amount of preprocessing required to extract the right images and efficiently send full range data to your browser. Thus, Unfolded Studio can interactively perform accurate high bit depth analytics, filtering and new visualizations on your GPU without reloading new server-processed images.

The browser-powered approach enables a dramatically improved user experience and enables new features such as interactive client-side color rescaling, spectral index analytics, and data filtering.
Color rescaling
Finding the most visually appealing rescaling parameters can be an iterative process. Change parameters and see the updated data rendered in a fraction of a second.
Spectral index analytics
A common way to visualize raster datasets is through the use of spectral indexes. For example, the Normalized Difference Vegetation Index (NDVI) algorithm takes data from the red and near-infrared wavelengths and computes an index value between -1 and 1 describing the amount of vegetation represented by that pixel. Along with a colormap, this index shows at a glance the contrast between verdant and barren landscapes.
Unfolded Studio computes various spectral indexes, such as NDVI, on the GPU. Since the full bit depth data is downloaded, scientific analyses such as spectral indexes in Unfolded Studio will achieve virtually the same results as in a desktop GIS. 1
Filtering raster data
With GPU-based pixel filtering, you can hide any pixels whose index value falls outside the desired range. This filtering is able to happen instantly because the data is already stored in the GPU.
Comparing raster data
Users of raster data often want to compare two raster datasets — perhaps the same dataset at different times (before and after an event of interest), the same dataset with different band combinations, or two different raster datasets.
Unfolded Studio provides a variety of ways to compare raster data.
Swipe Mode
The swipe mode renders two layers into the same viewport, but adds a vertical slider that allows users to change which portion of the screen is rendering which layer.
Side-by-side Mode
The side-by-side mode renders the same viewport into two halves of the screen. This means that each half of the screen is always viewing the same area, in contrast to the swipe mode where each half renders neighboring areas.
3D Mode
Toggle into 3D view to see the same high bit-depth raster data rendered over extruded terrain. This is a great way to visualize raster data in mountainous areas.
All the same analytical capabilities are possible in 3D mode. For example, at Mount St. Helens in Washington State, the 3D view augments the understanding of the raster data. In 3D view and with the band combination preset set to Infrared false color or Normalized Difference Vegetation Index (NDVI), treeline and the remnants of volcanic flows that scorched vegetation are clearly visible.
Combining Raster and Tabular Data
Unfolded Studio’s new raster support comes in addition to its existing broad support for tabular datasets. Working with both types of data can bring new insights. In the below screenshot, median household income in San Francisco is overlaid onto false-color infrared NAIP imagery. One can visually see the correlation between income and proximity to green space (the deeper reds signify higher vegetation levels).

Map SDK
Enterprise customers can access additional Raster Tile APIs in the Map SDK, enabling creation of custom COG viewers and analytics tools on top of the Unfolded Platform.
Using the Raster Tile Layer

This initial release includes three Raster Tile datasets, exposed through the Unfolded data catalog, including Landsat 8, National Agriculture Imagery Program (NAIP) and Sentinel-2.
To create a new map with a Raster Tile layer, open the Unfolded Data Catalog page, then select a raster dataset from the “Remote Sensing” section and click “Create Map”.
To add a Raster Tile Layer to an existing map, in the “Add Data” dialog, choose the “Data Catalog” tab, then choose a raster dataset.
In each of the two above methods, a Raster Tile Layer will automatically be created, which you can find in the left sidebar.

Under the Hood
Two foundational technologies and standards underpin Unfolded Studio’s client-side raster rendering: Cloud-Optimized GeoTIFFs and STAC metadata.
Cloud-Optimized GeoTIFFs
Cloud-Optimized GeoTIFFs (COGs) are a great format for storing massive raster datasets because they permit efficient random access of small portions of the broader image. Unfolded’s backend draws from COGs to serve high bit-depth tiles of raster data on-demand from petabyte-scale archives.
STAC
Spatio-Temporal Asset Catalog (STAC) is the emerging metadata standard to describe Cloud Optimized GeoTIFFs. Many satellite data providers are converging on providing STAC enabled endpoints, making it possible to directly search and consume satellite imagery from multiple sources.
The Raster Tile Layer works with STAC files under the hood, enabling exciting opportunities for the future. Future releases of Unfolded Studio will support rendering custom COGs referenced by a user-provided STAC item.
Roadmap
The support for raster data in the Unfolded Platform that launched today is just the beginning. We are actively working on building out even stronger support for raster data.
Expect to see improvements in areas like:
- Data Catalog – Stay tuned for more high-quality public and commercial raster tiles pre-integrated into the Unfolded Data Catalog.
- Custom Raster Data – Visualization of user-provided STAC items.
- Data SDK APIs – Programmatic access to Unfolded’s on-the-fly COG processing.
- Analytics – Hover to inspect pixels, compare COGs, etc.
- Unification – Seamlessly work with both raster and tabular data.
- Search – Search COG archives based on spatial, temporal and metadata parameters.
As always, we would love your thoughts on this new feature and the roadmap ahead. Join the Unfolded Community to ask questions and give feedback.
- Some analyses may have slightly different results due to resampling and the reprojection process into Web Mercator.↩